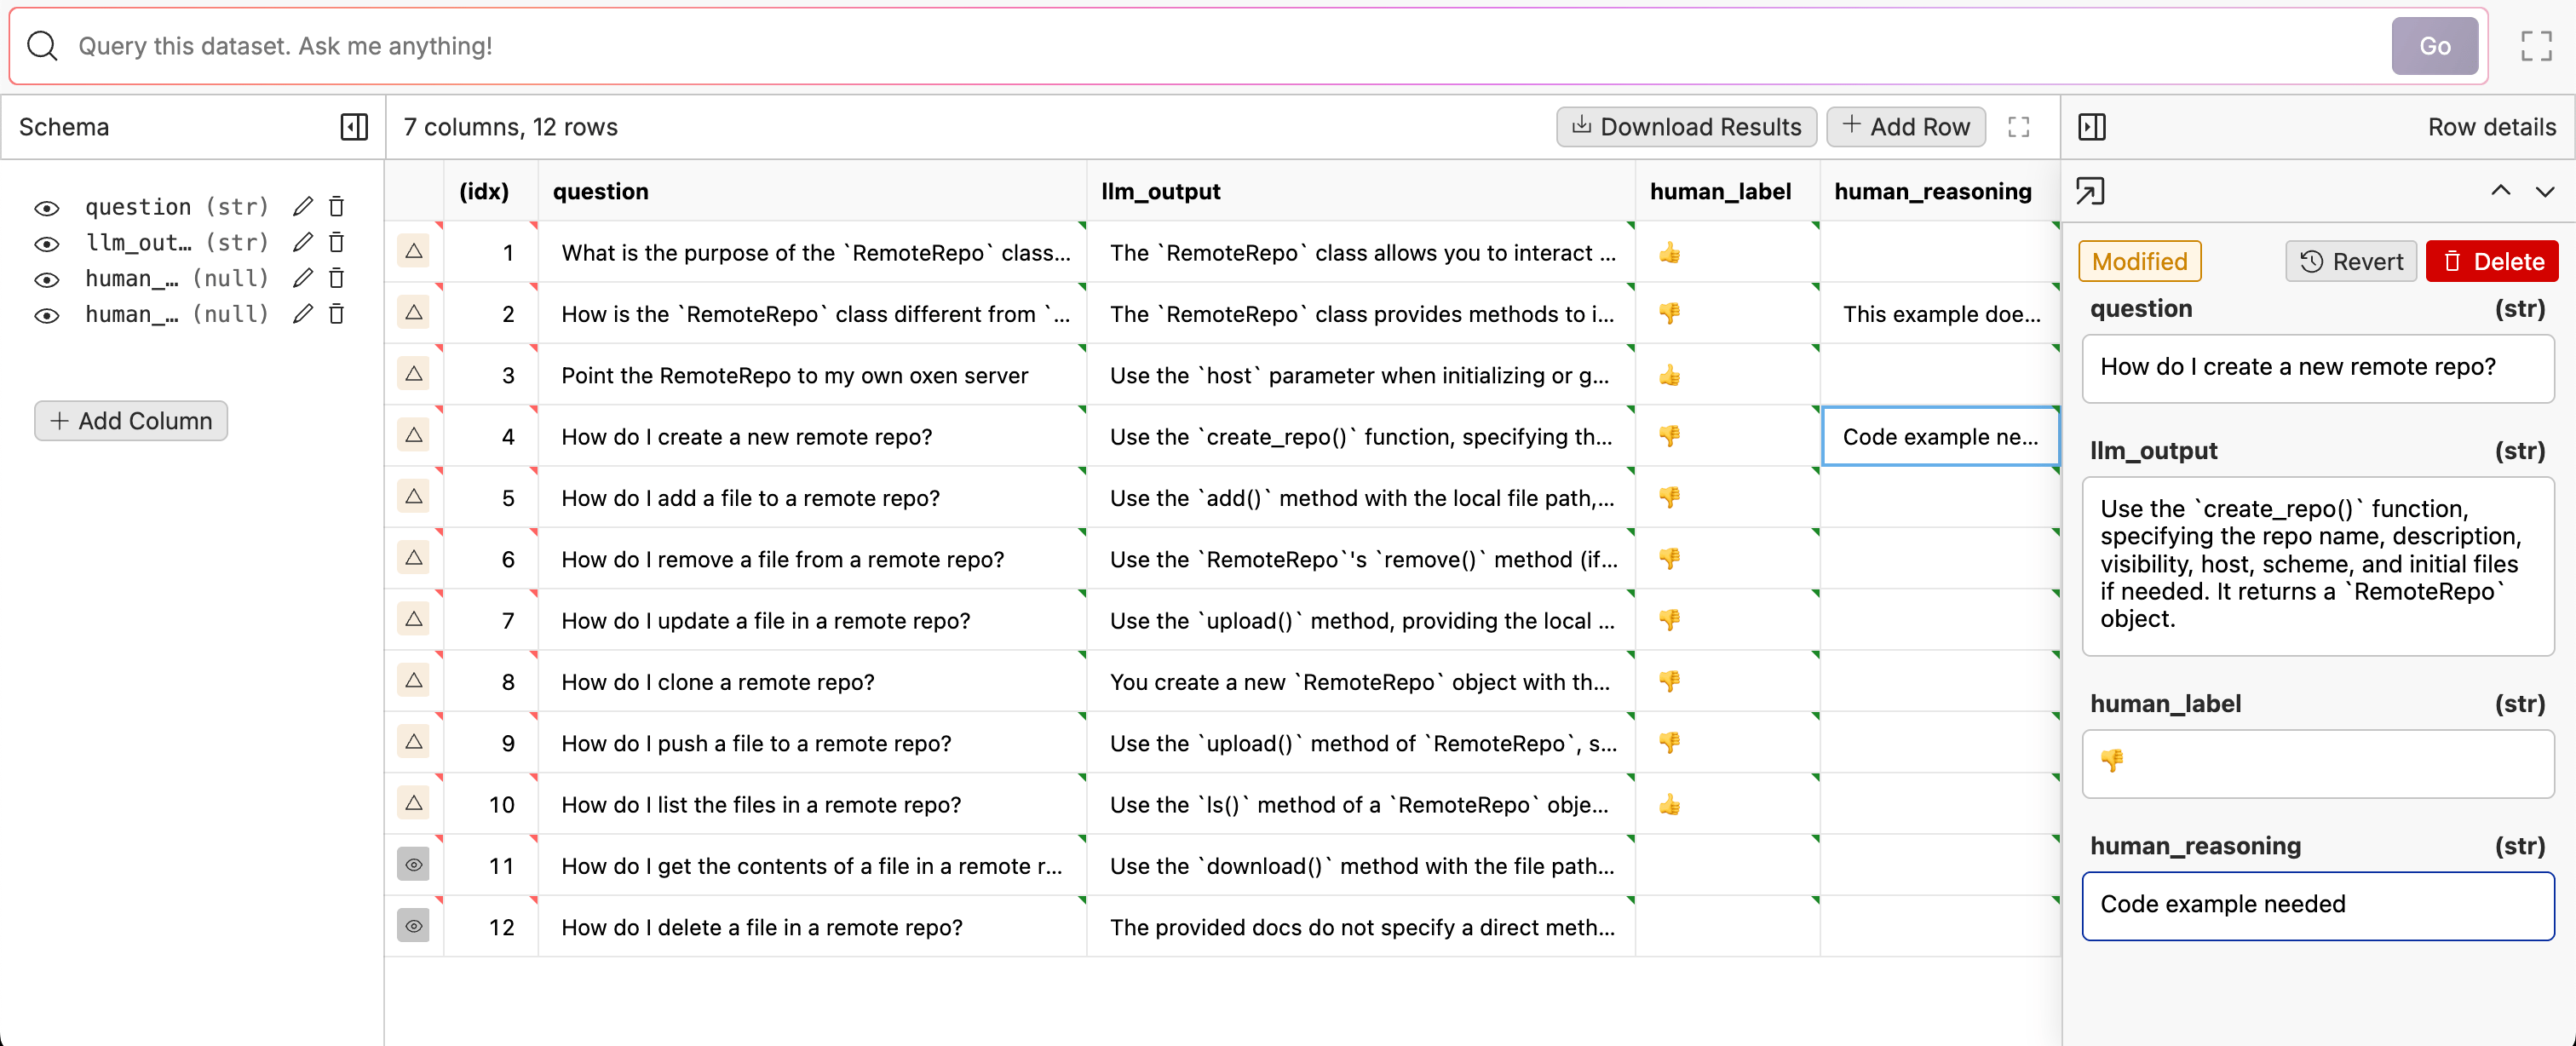
One of the most reliable ways to evaluate an LLM is to have a human in the loop reviewing each input and output pair. Having human eyes not only will catch errors that the LLM missed, but it will also spark ideas for how to improve the model. Once you have a dataset of labeled examples, you can use it to train a new model, or compare the performance of different models. This tutorial will show you how to build a simple labeling tool that allows a human to review the output of an LLM, and give a thumbs up or down (πŸ‘/πŸ‘Ž). All your labeled data will be versioned and stored in an Oxen.ai repository so that you can always go back and see how the model’s performance evolved over time and iterate on it with your team. Oxen.ai Data Frame

Example: Asking questions about Oxen.ai’s Python Library

For this example, we will see how well an LLM can answer questions about developer docs. We will use the Oxen.ai Developer Docs as our context. This tutorial will show you how you can prompt an LLM with context, save the outputs, and build an interface to have a human review the output. Follow along with the example notebook by running it in your own Oxen.ai account. Human in the Loop
Creating the Dataset

The dataset will consist of 10 questions about the RemoteRepo Python class. For your use case, a small dataset is better than none, and you can always scale up. Even if it is only a few examples to start, this allows you to setup and kick off your data flywheel.
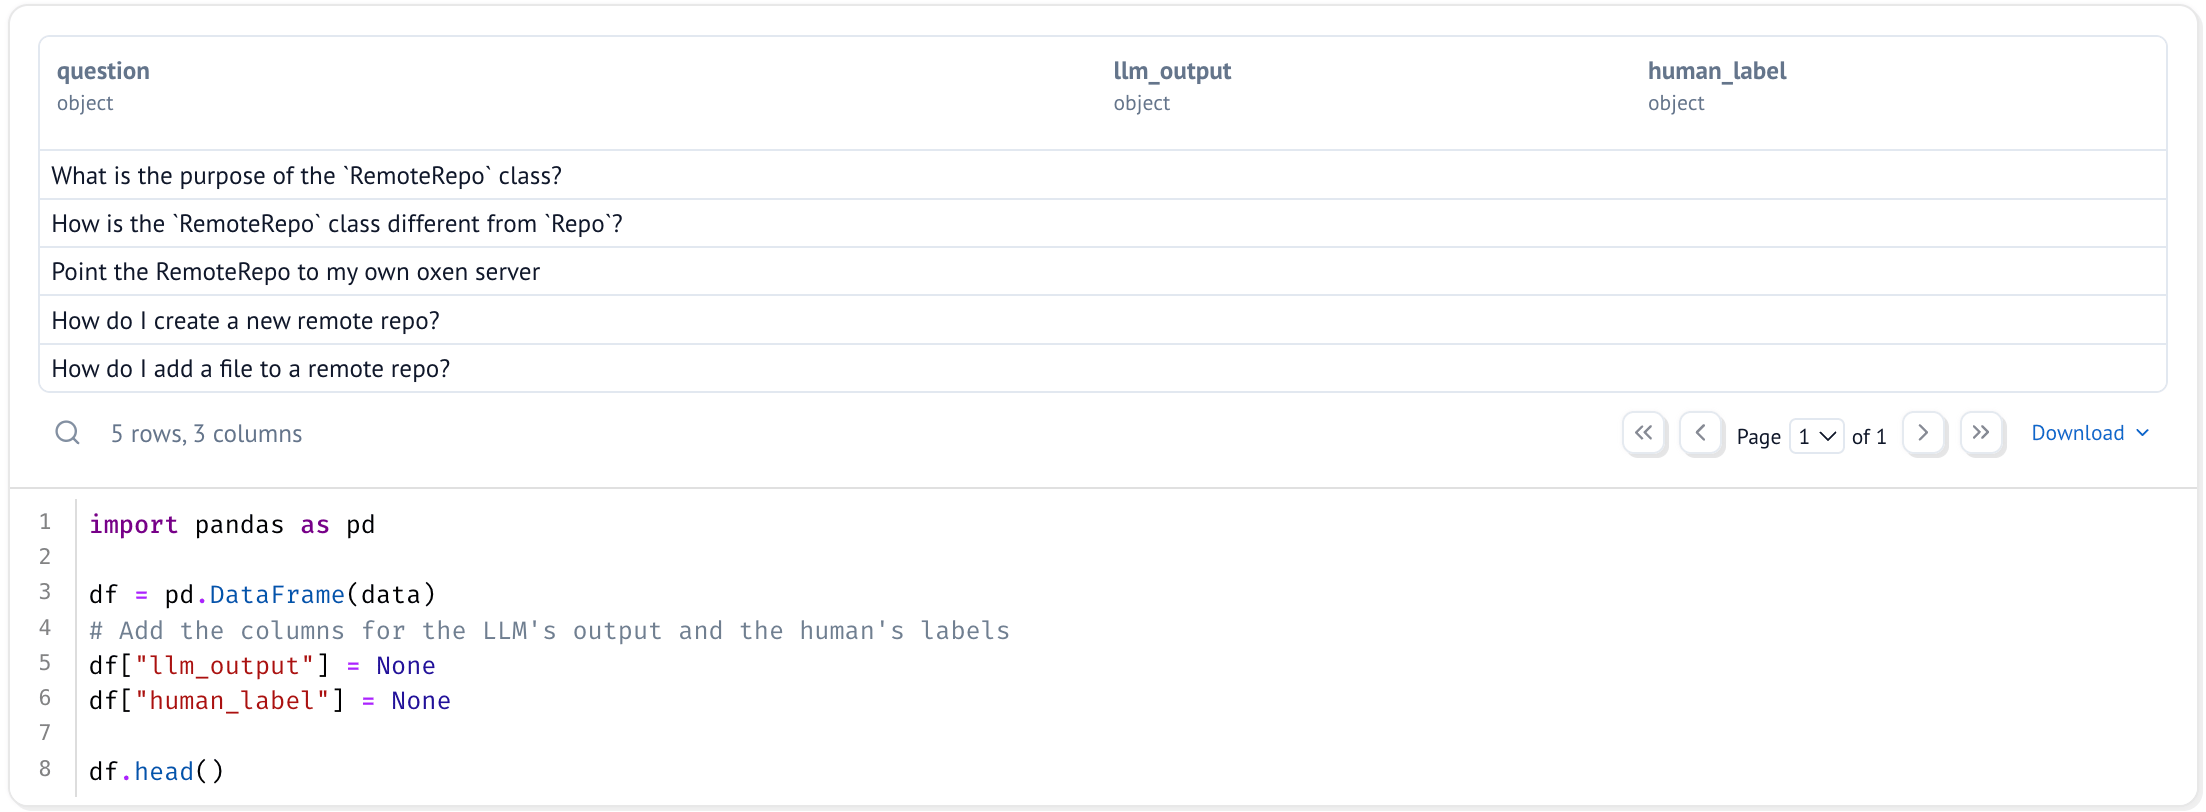
Create a data frame from these questions, leaving a couple columns blank for the LLM’s output and the human’s labels.
Dataset

Using a Model

For this example, we will be using gpt-4.1-nano to see if OpenAI’s fast and cheap model can perform the operations we need. To start, make a cell at the top of the notebook that allows the user to put in their own OpenAI API_KEY.
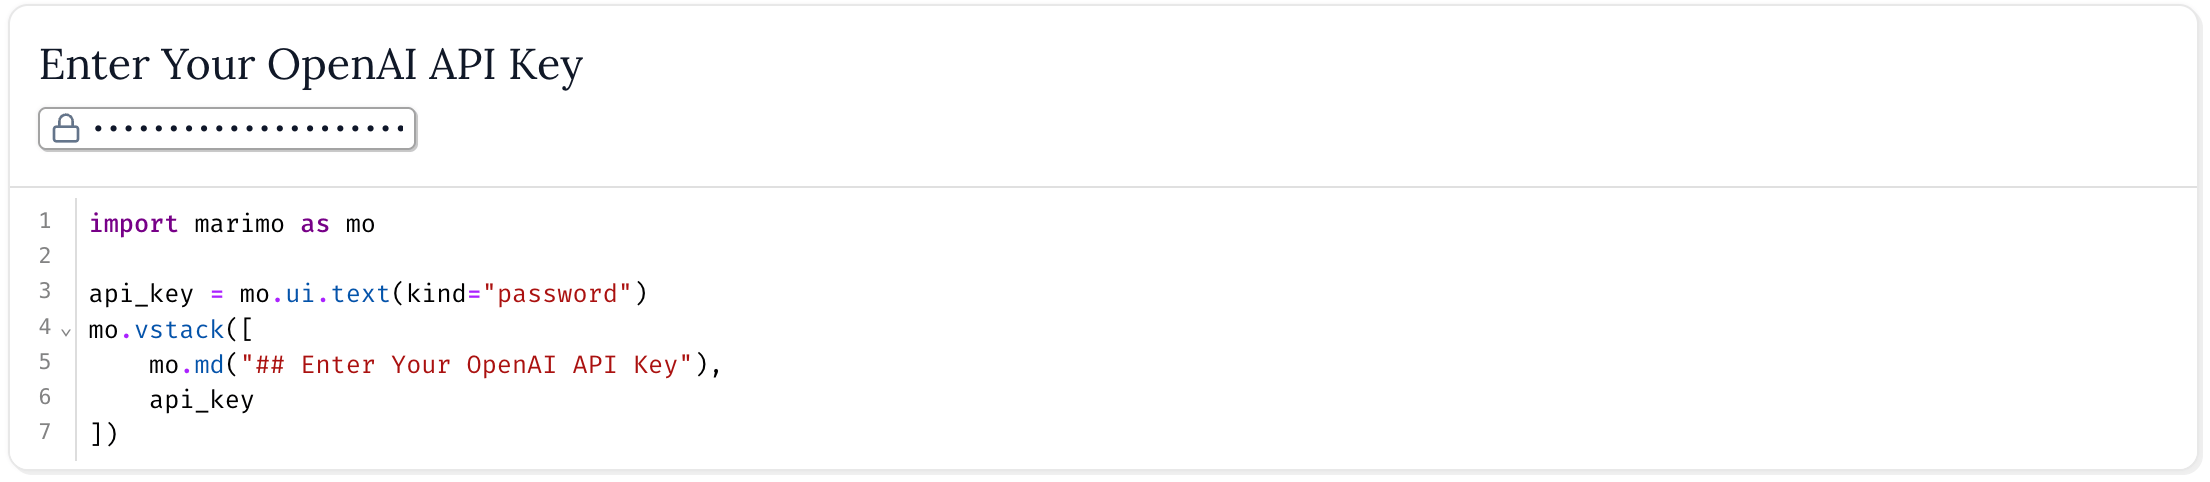
API Key We can then use the output of this cell to stop execution further down in the notebook until the user has put in their API_KEY.

Building the Context

For updates to developer docs, it is best to assume the model does not yet know the latest information. To help the model, we can provide it with the latest docs as context.
Once we have the context, we can define a simple function to make our LLM call and pass it in.

Running the Model

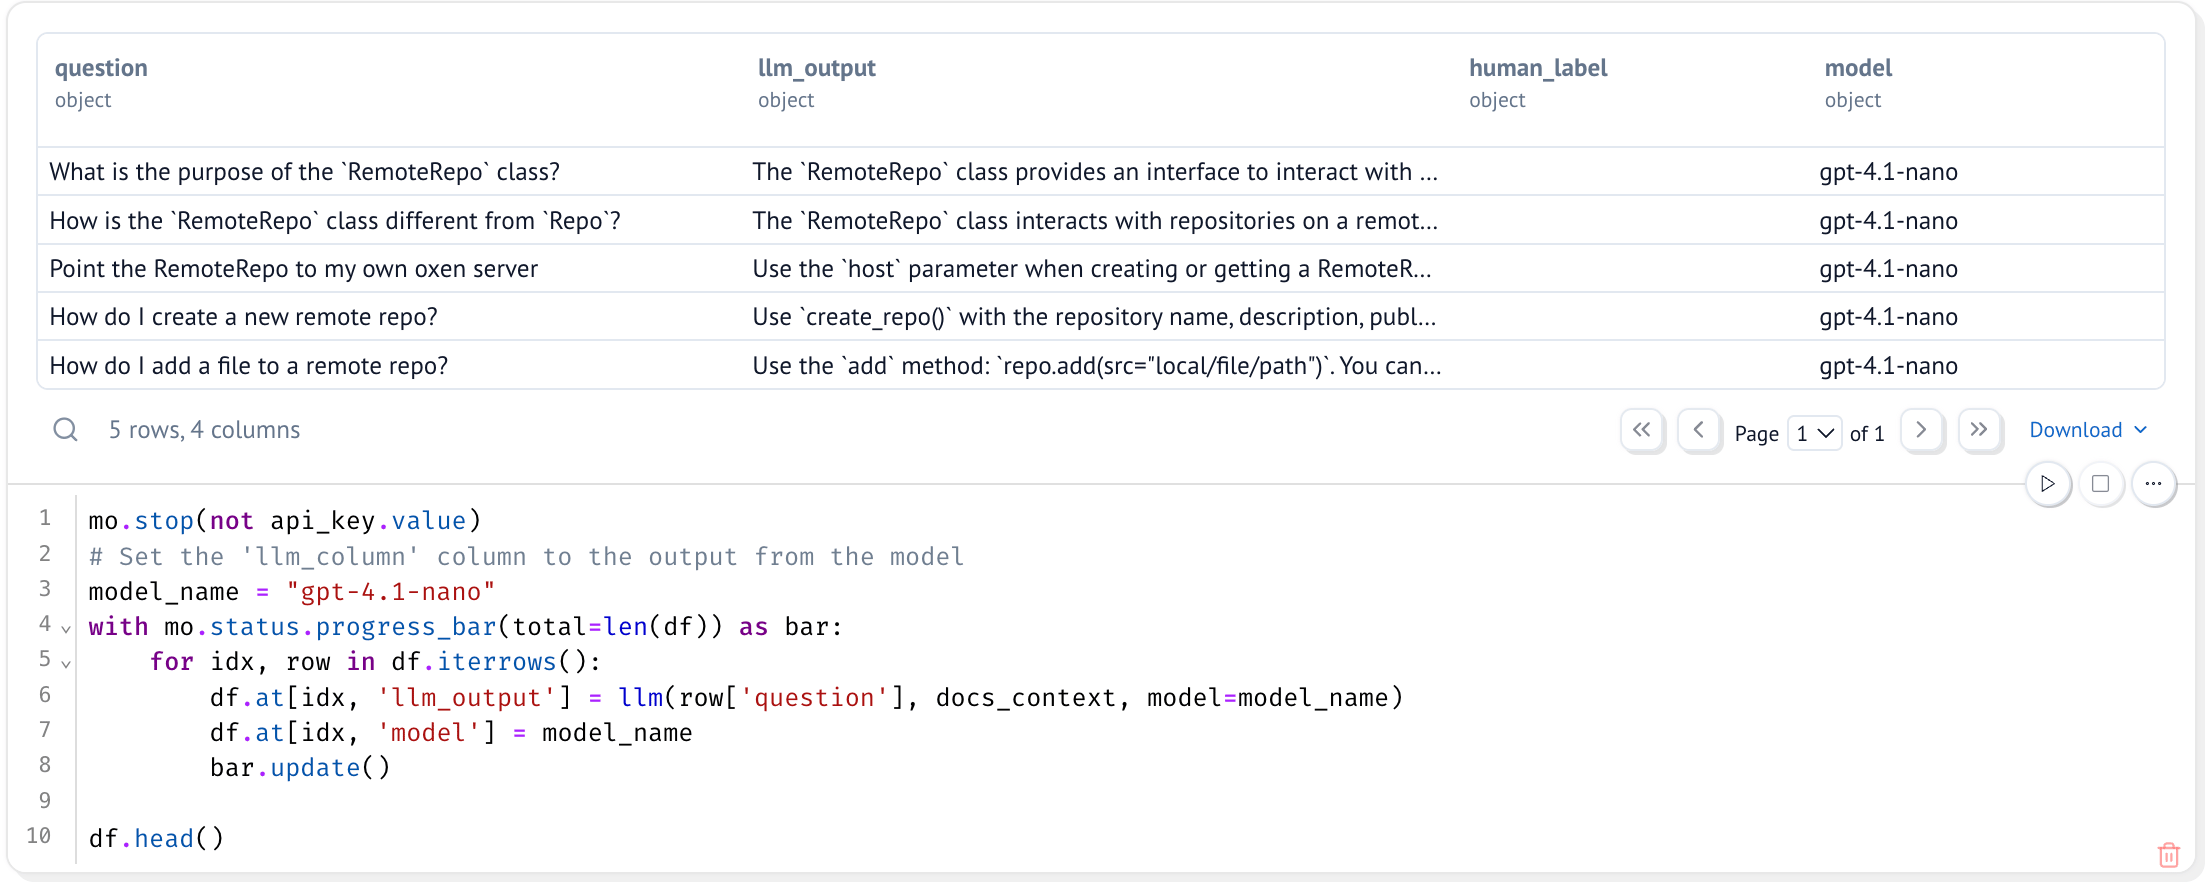
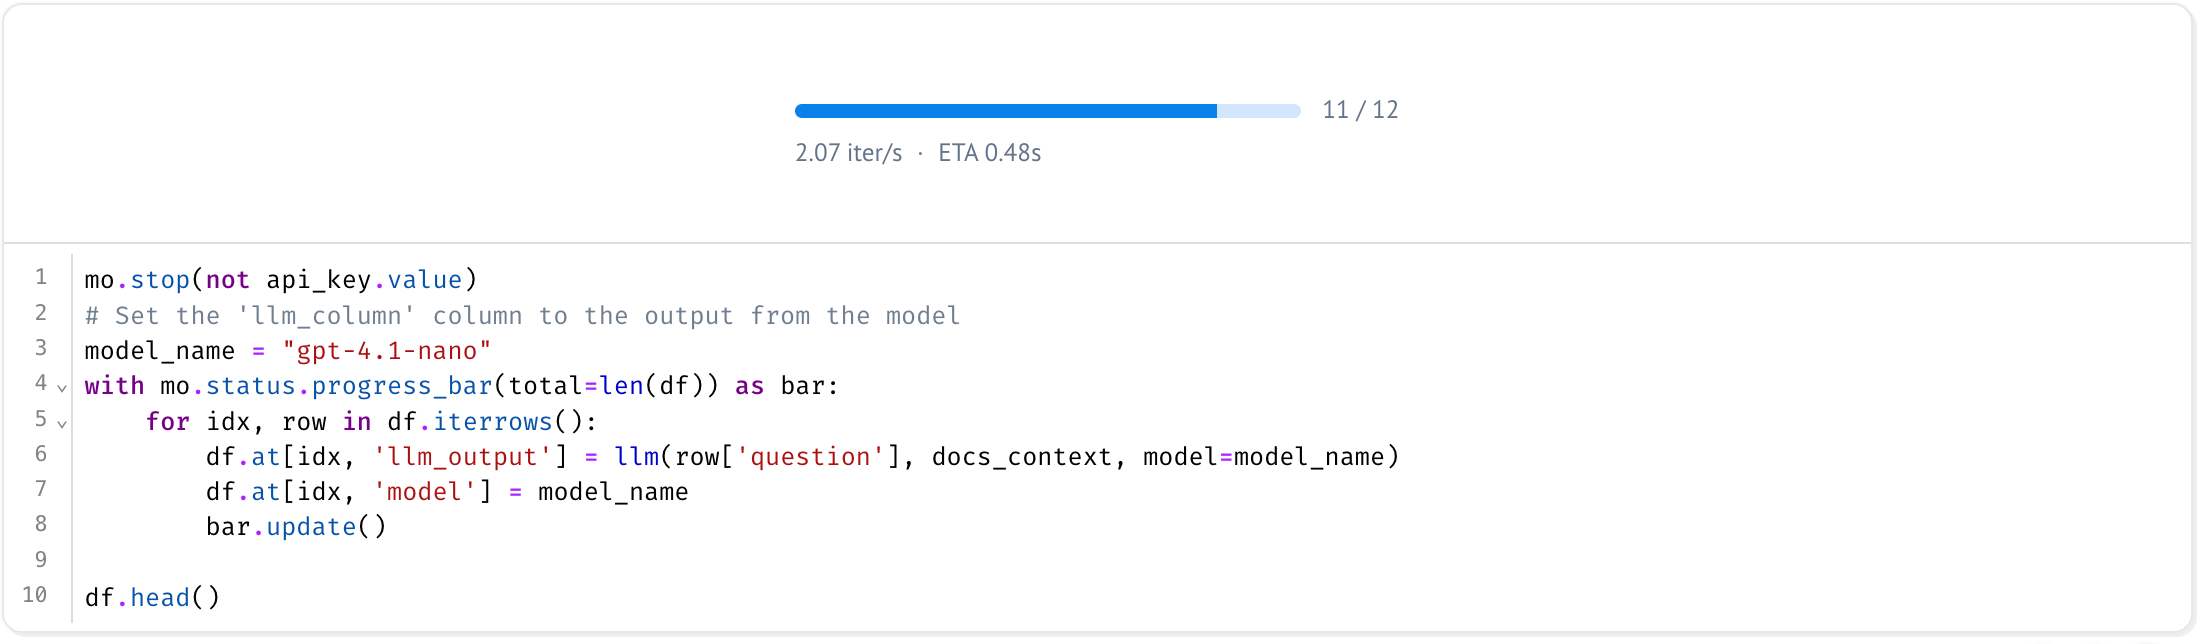
Now that we have our model, and our context, we can use it to answer all the questions.
The with mo.status.progress_bar(total=len(df)) as bar: is a Marimo feature that allows you to display a progress bar in the notebook to help you visualize the progress of the loop. This is helpful when you have more than 10 examples and want to know how much longer the loop will take. Progress Bar After we have run the model, the dataset should look like this: Saving Results PS: If you want to play with different prompts and models without having to write code, you can use also use the Oxen.ai Model Inference Playground for this part.
Saving the Results

Before we build our labeling tool, let’s save the results to Oxen.ai.
Notice the last line also creates a variable called remote_df that we can use in our labeling tool.

Building a Custom Labeling Tool

Now that we have the results saved, we can build a simple labeling tool to label the results. We’ll need some state to keep track of the current index of the dataframe, and the current row.
Then some functions to get the current row and move between rows.
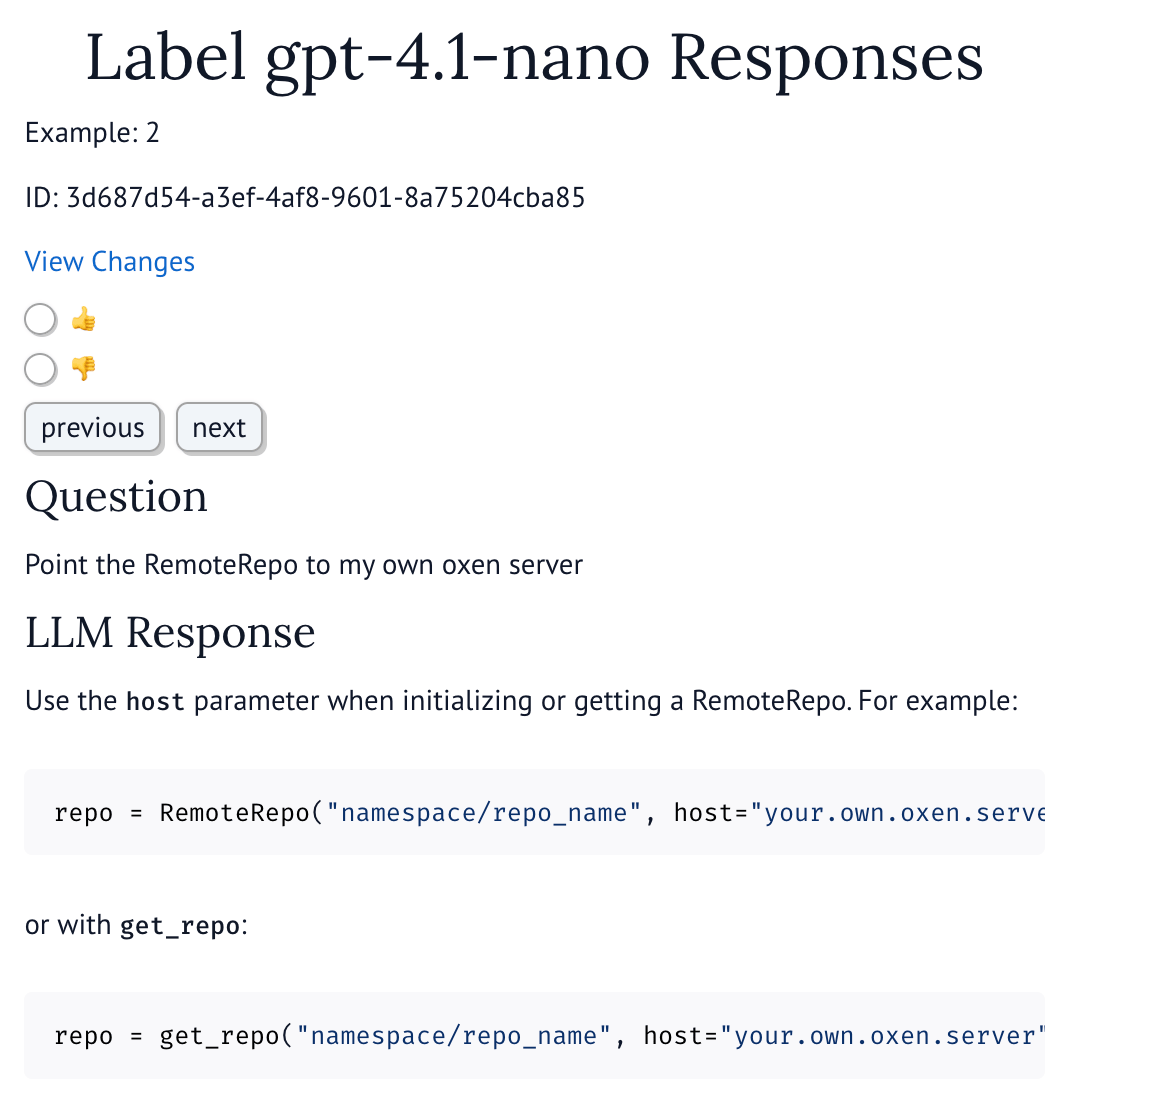
Finally, we can build the UI for the labeling tool.
The final output should look like this: Human in the Loop When you click a label with the radio button, the label is saved to the dataframe and the index is incremented. You can click the β€œView Changes” button to see the changes you’ve made to the dataframe before committing them to the repo. If you want to save the changes programmatically, you can use the remote_df.commit() method.
Take this example as a starting point, and build your own labeling tool to fit your needs. You may want to add a score, or a reason for the label, or even a more complex UI that lives outside of Marimo. If you don’t need a custom labeling workflow, feel free to use the built in DataFrame UI in Oxen.ai that feels like editing a spreadsheet.